How to prepare a structure for documents?
When organizing your view for documents in coda.io, you need to keep in mind that all the most important information you want to store will be in the form of TABLES.
The TABLES will be connected behind each other by relationships and formulas. We want to achieve a structure in which we do not duplicate places for entering data, and we treat once defined data as global for use in many places. Thanks to this approach, in case of editing basic assumptions, the document structure will not be overturned, and the data created so far will be updated.
At this stage, our overall structure will have the following breakdown:
What are our plans for the established tabs and what are they?
In fact, they are each item is a separate document, inside of which may be target content or nested subsequent documents. We will use each option using the above division as directories for the data we store. We will start with the basic data that pertains to a particular section, and the structure will grow with subsequent entries.
- PMFOR – BLOG:
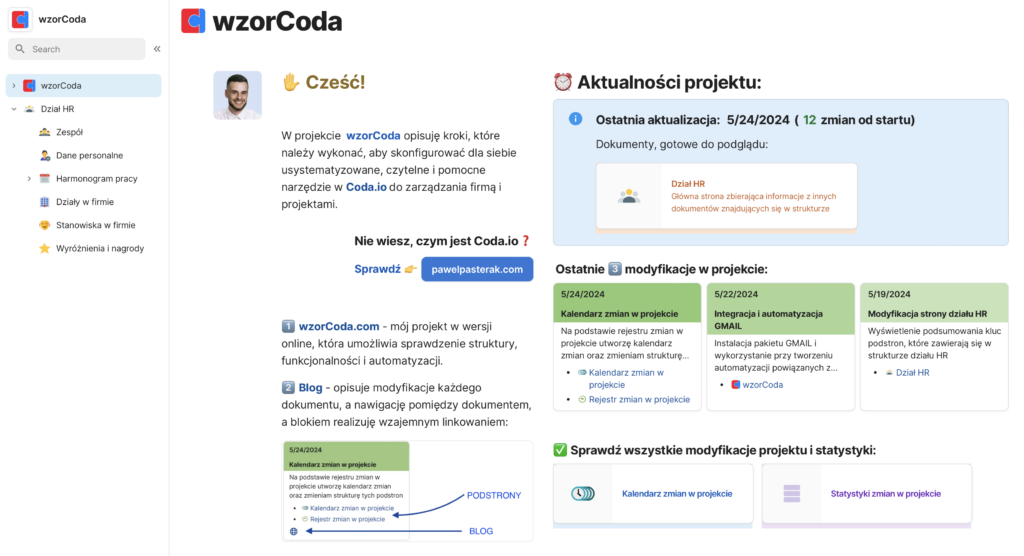
The first document most often used as the main Dashboard in the organization – eventually inside this directory we will display the main information about the company, assumptions, personnel status and statistics about the business. We will spend the most time on statistics, as this will be the page that will take information for display from other documents. Currently, we will make this a blog Dashboard - HR section:
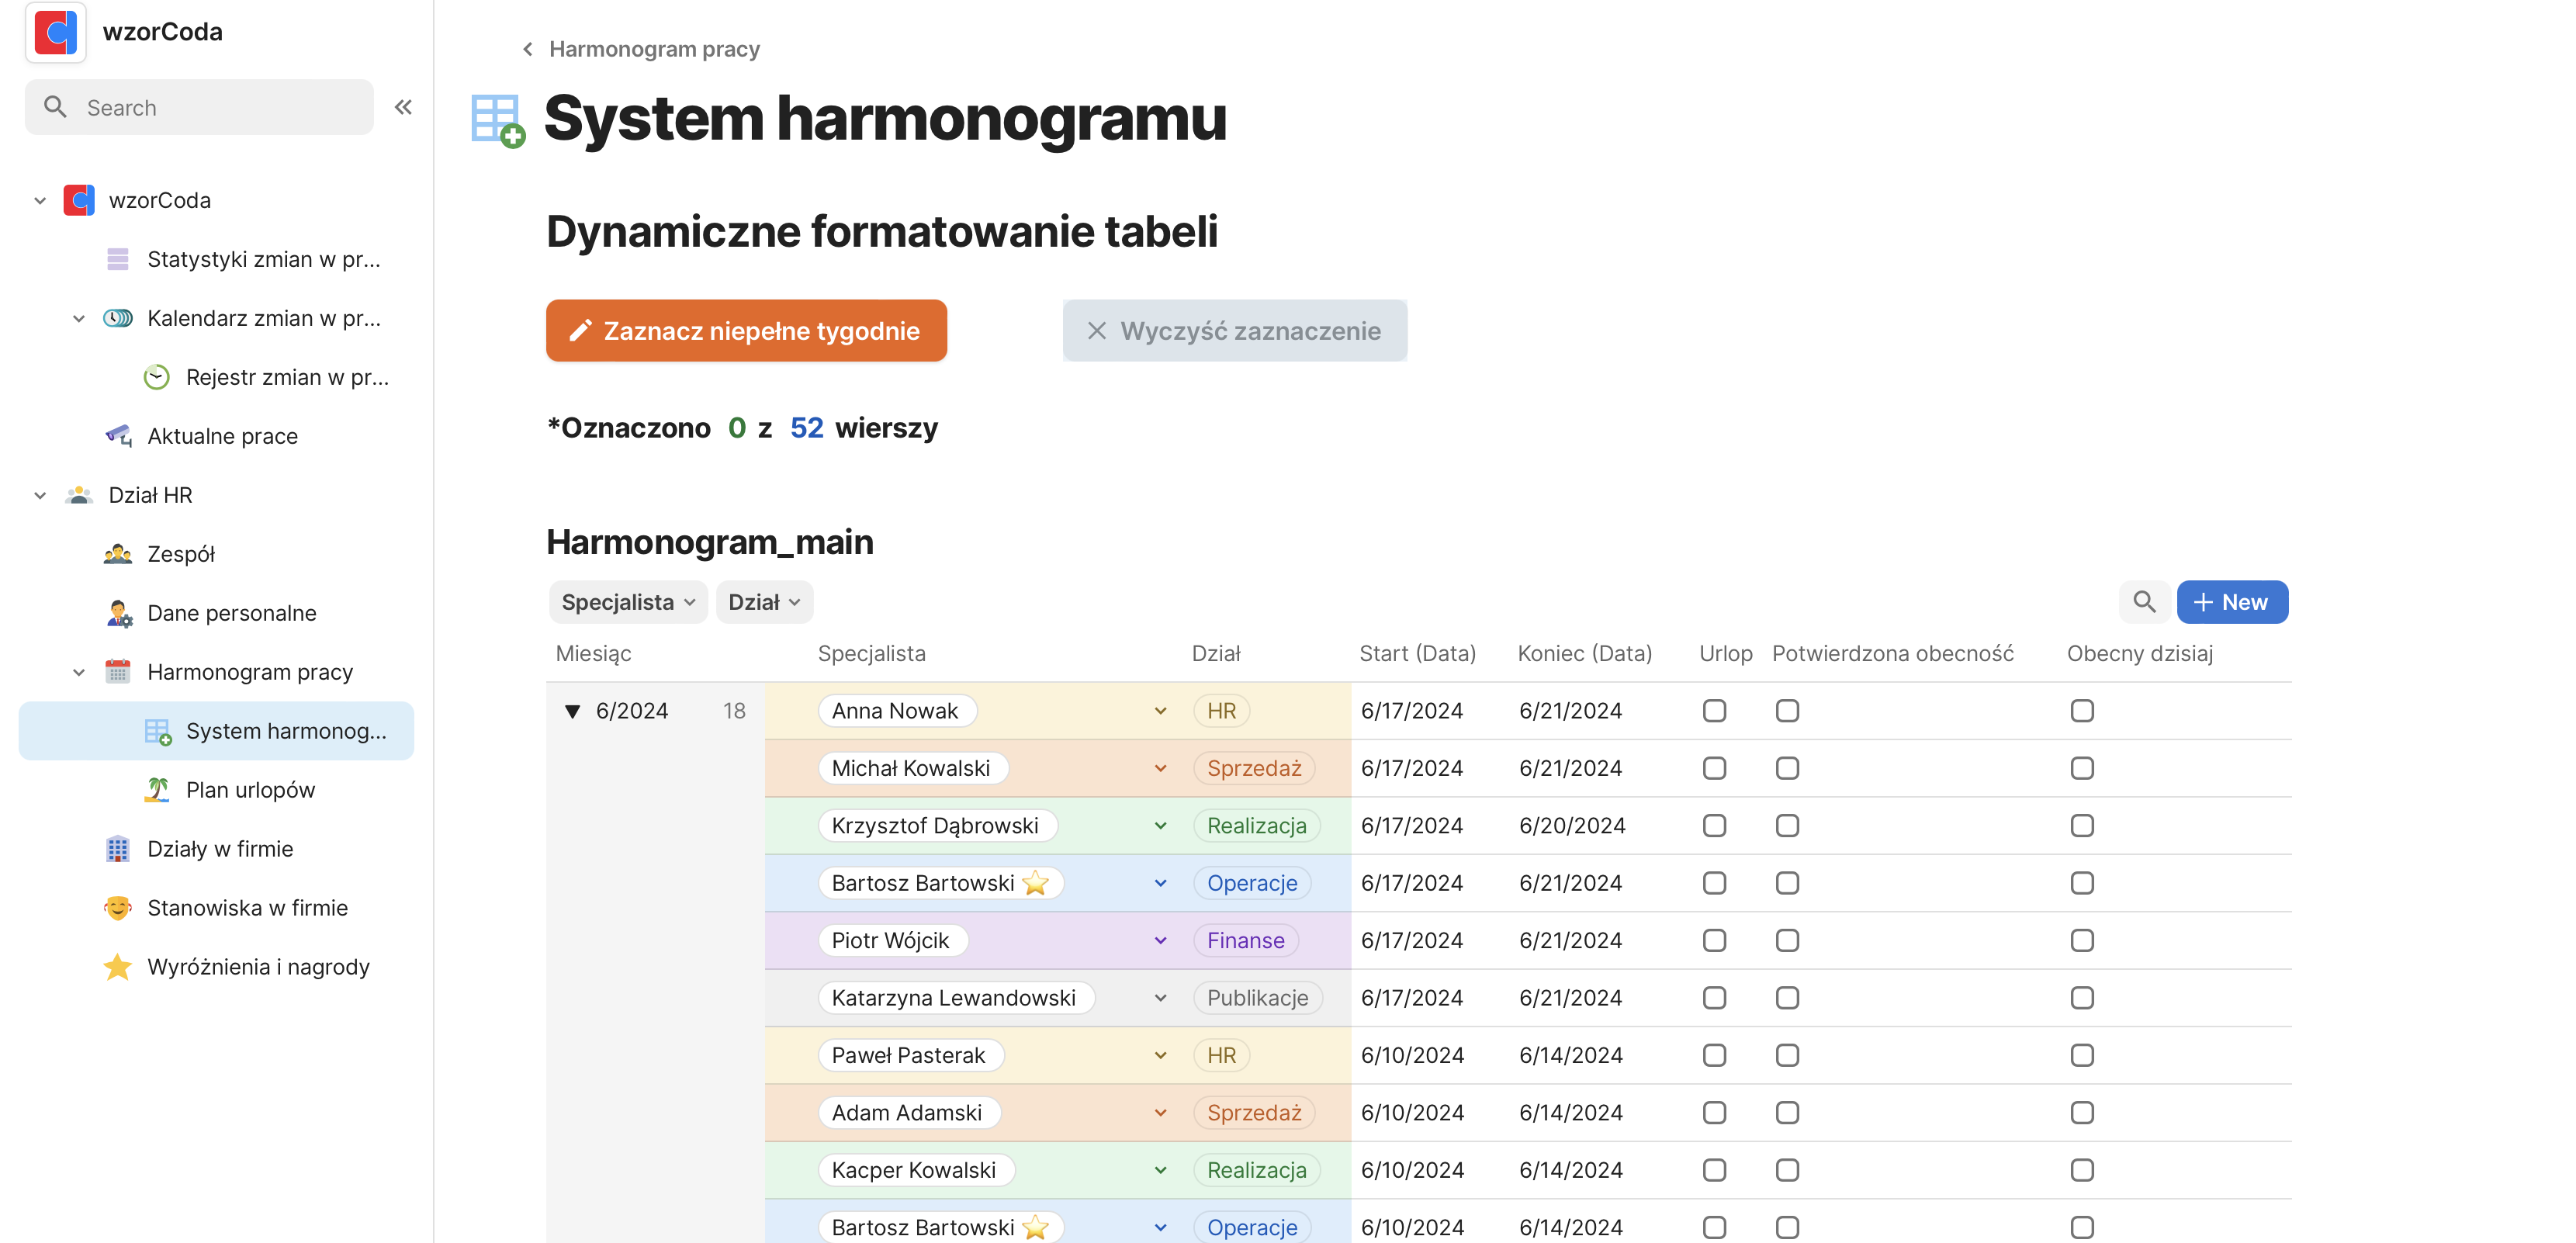
In this tab we will keep all the information about the HR department starting with preparing tables for the personal data of people related to the company - SALES department:
We will start by registering clients for whom we will carry out projects - PROJECT IMPLEMENTATION department:
In our example, a company implementing web projects within one department will bring together graphic designers, developers, testers. Also, the structure will grow with time.
The implementation department will use a table of clients and team - OPERATIONAL department:
Along with the creation of our structure, guidelines for the execution of specific tasks (processes/instructions) will be created. Elements that can be automated within the defined descriptions will be automated within the coda.io tool - FINANCE Department:
FVs are issued for completed tasks. We will create a system that will summarize the work within a given month and indicate to which client a FV should be issued in a specific amount and for which work - PUBLICATIONS Department:
Created for a series of blog posts being created. I will store the schedule of entries and specific entries in this very directory
We will start by modifying the homepage.
We will make a Dashboard that informs about the current status of the blog:
1. we will add two new sub-pages:
Subpages appeared in the document tree and under the title of the main page *this can be hidden.
2. Will prepare the structure under what I would like to display in the dashboard:
I divided the view into two commons, and then in the new one I put Information about the last entry, the number of all entries, the number of publications in the last 30 days and a graph of publications by month
For now it’s just text, but we already know what we are aiming for 🙂
In the created tab UPDATES I put a table where I will put information about published entries.
Date of creation, title of the entry and link
Each column takes values of a different type (from left): Date, Text, Url
Here we will perform the first automation:
We will not enter the date manually. We’ll set it so that the creation date of the row is always there:
I complete the information of the published entry:
We return to the home page and breathe the first “life” into it:
The following entry will retrieve and insert the last entry from our blog entry table
Automatic count of all entries:
Entries from the last 30 days:
Recent: a chart of the number of entries for each month:
We will create an alternative view of the existing table (i.e., the data between these tables is synchronized online – it’s one table having two views
I added a column for the ability to group entries by month (the column also takes values automatically) + added two test entries to check the correctness of the calculation
Changed the table to a chart and moved to the Dashboard page:
Immediately it came out that the case of not providing a link to an entry (as below) should be handled
Immediately it came out that the case of not providing a link to an entry (as below) should be handled
Now we will slightly modify the appearance + remove the test entries from the table:
After this post, I encourage you to create your free account on coda.io. In the next entries we will develop the created structure and create functionalities that will allow you to effectively manage your business