Coda.io lets you format tables in lots of different ways, depending on what you need.
You can make sure your table is easy to read, whether it’s got static data or is being updated in real time.
You can make sure your table is easy to read, whether it’s got static data or is being updated in real time.
You can also use filtering options to show only the data you want to analyse. What if we want to tag specific items in an existing table, but don’t want to change the current view?
In this post, we’ll show you how to create a button that lets you format tables on the fly.
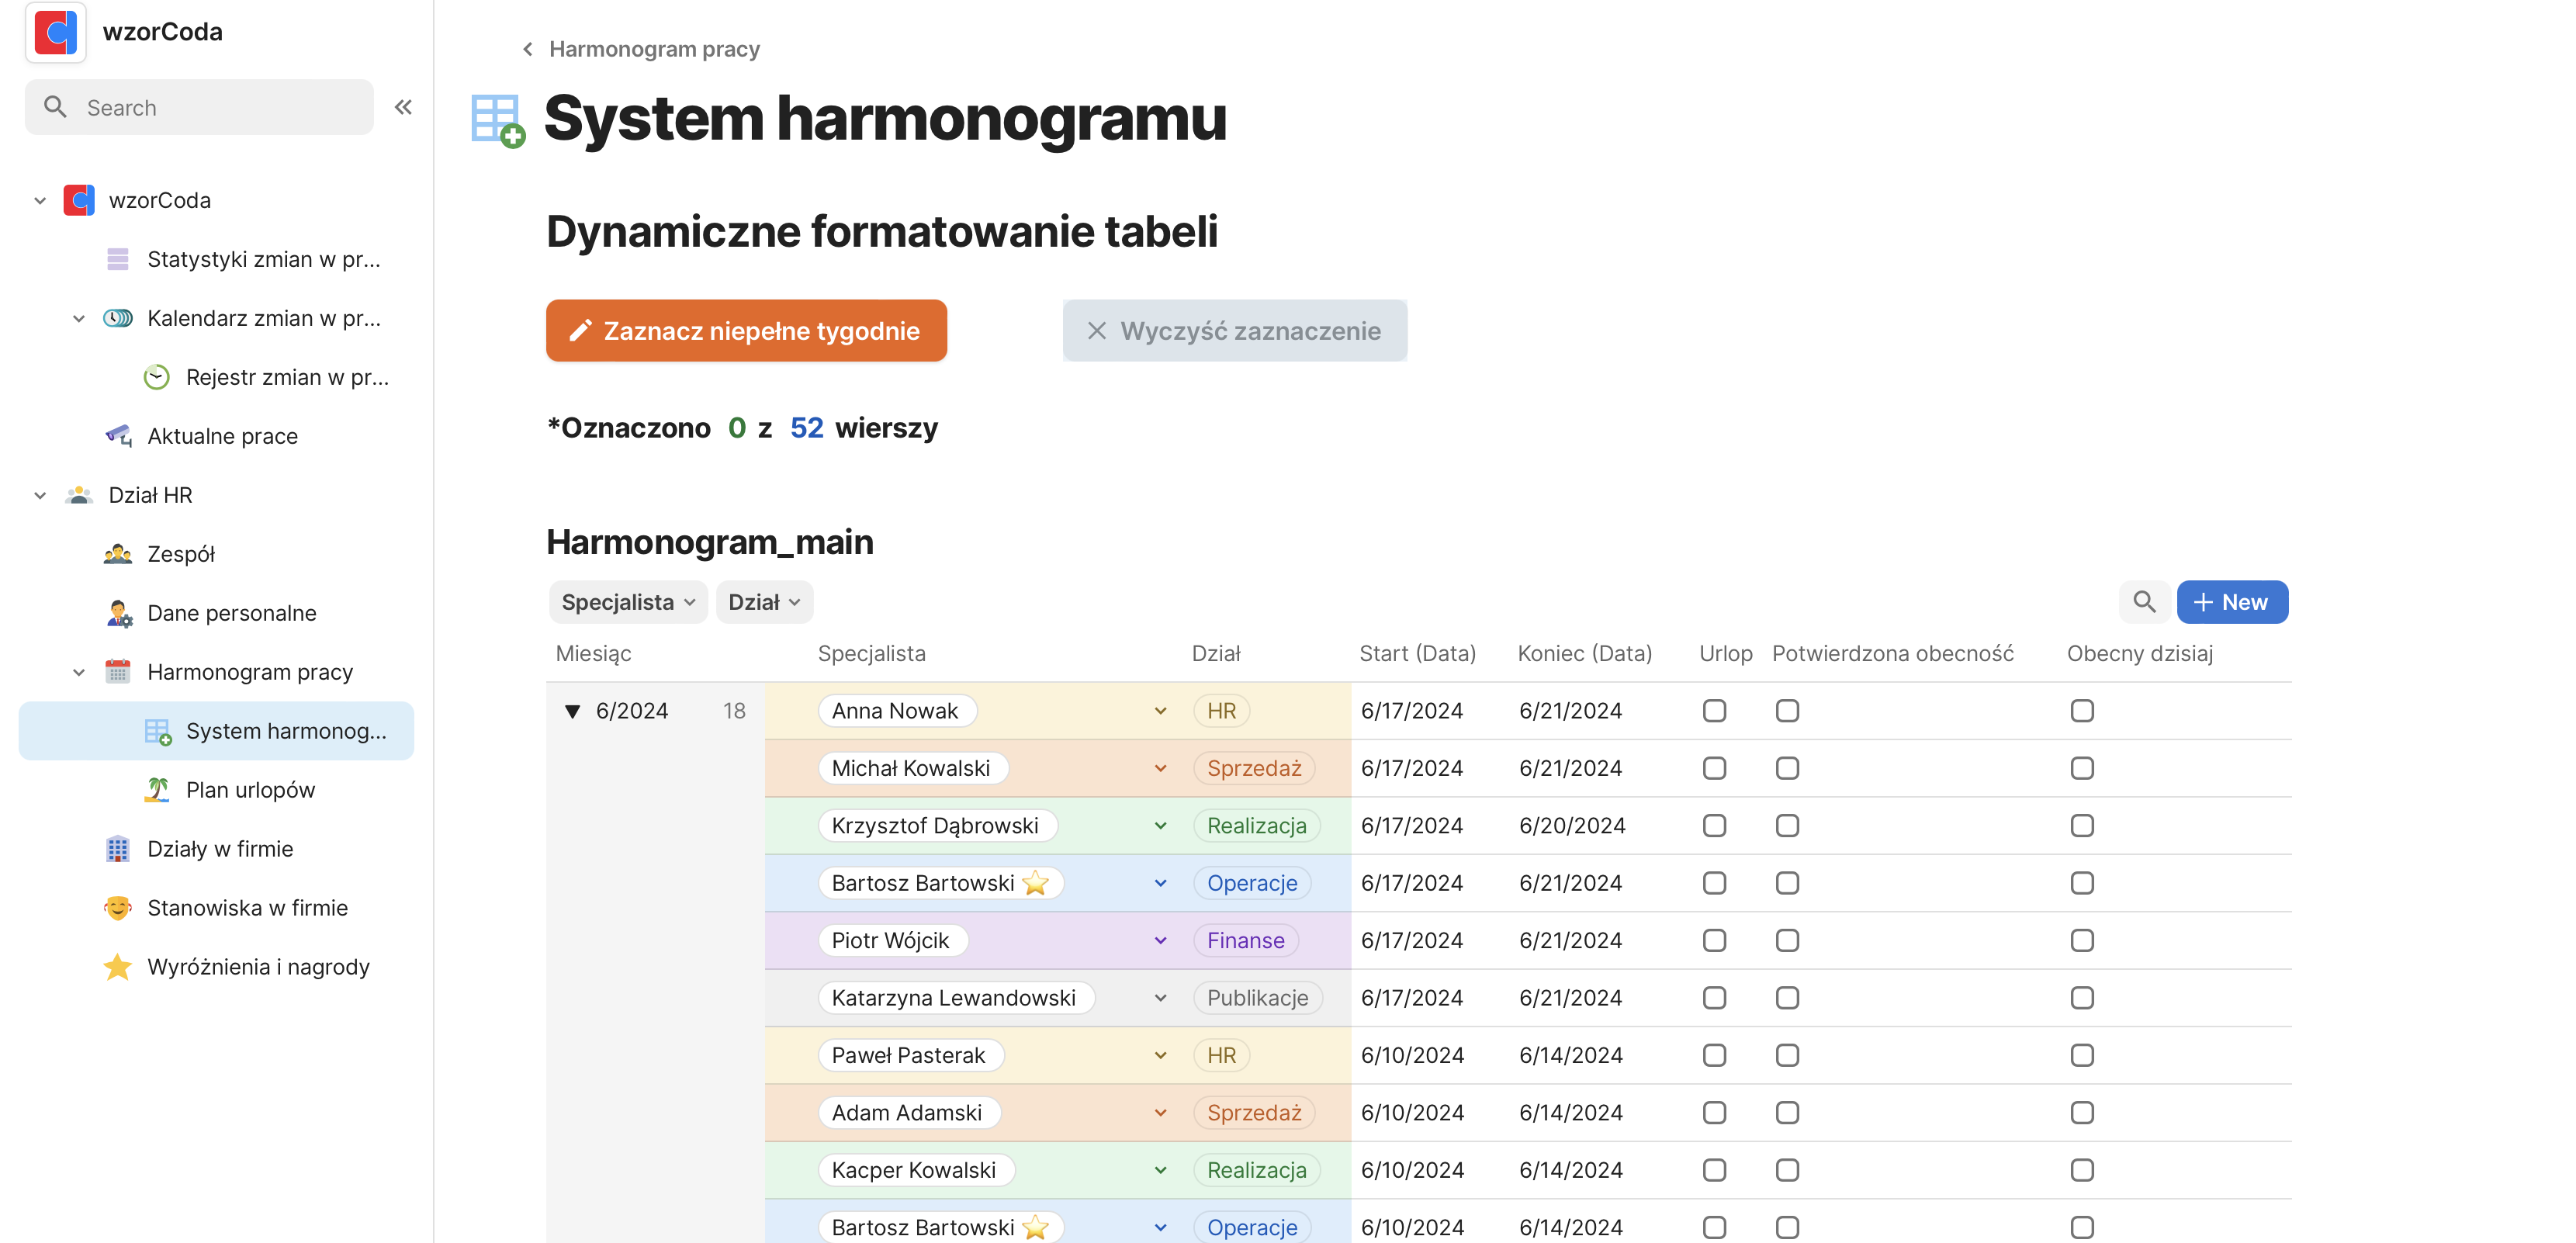
We’re going to format the work schedule table so that it shows items with a non-standard number of days, like 6 days a week.
To do this, we’ll perform:
1. We’ll add a new button that lets you turn the formatting on and off.
2. In the schedule table, we’re going to add a new column that lets you select rows where the number of scheduled days is less than five.
3. We’ll add the standard formatting for rows that have the incomplete week formatting box checked (still manually).
4. In the new button, we add a bit of code that will search the Schedule_main table for items where the number of work days is less than 5 and greater than 1. For these items, it will mark the incomplete week formatting.
5. I’ll rename the button and add an option to deactivate it after use.
6. I’ll create a button for deleting formatting, and we’ll have a fully functioning way of marking rows that meet the set conditions.
7. Finally, I’ll add a stats section showing how many items have been marked in the current marking.