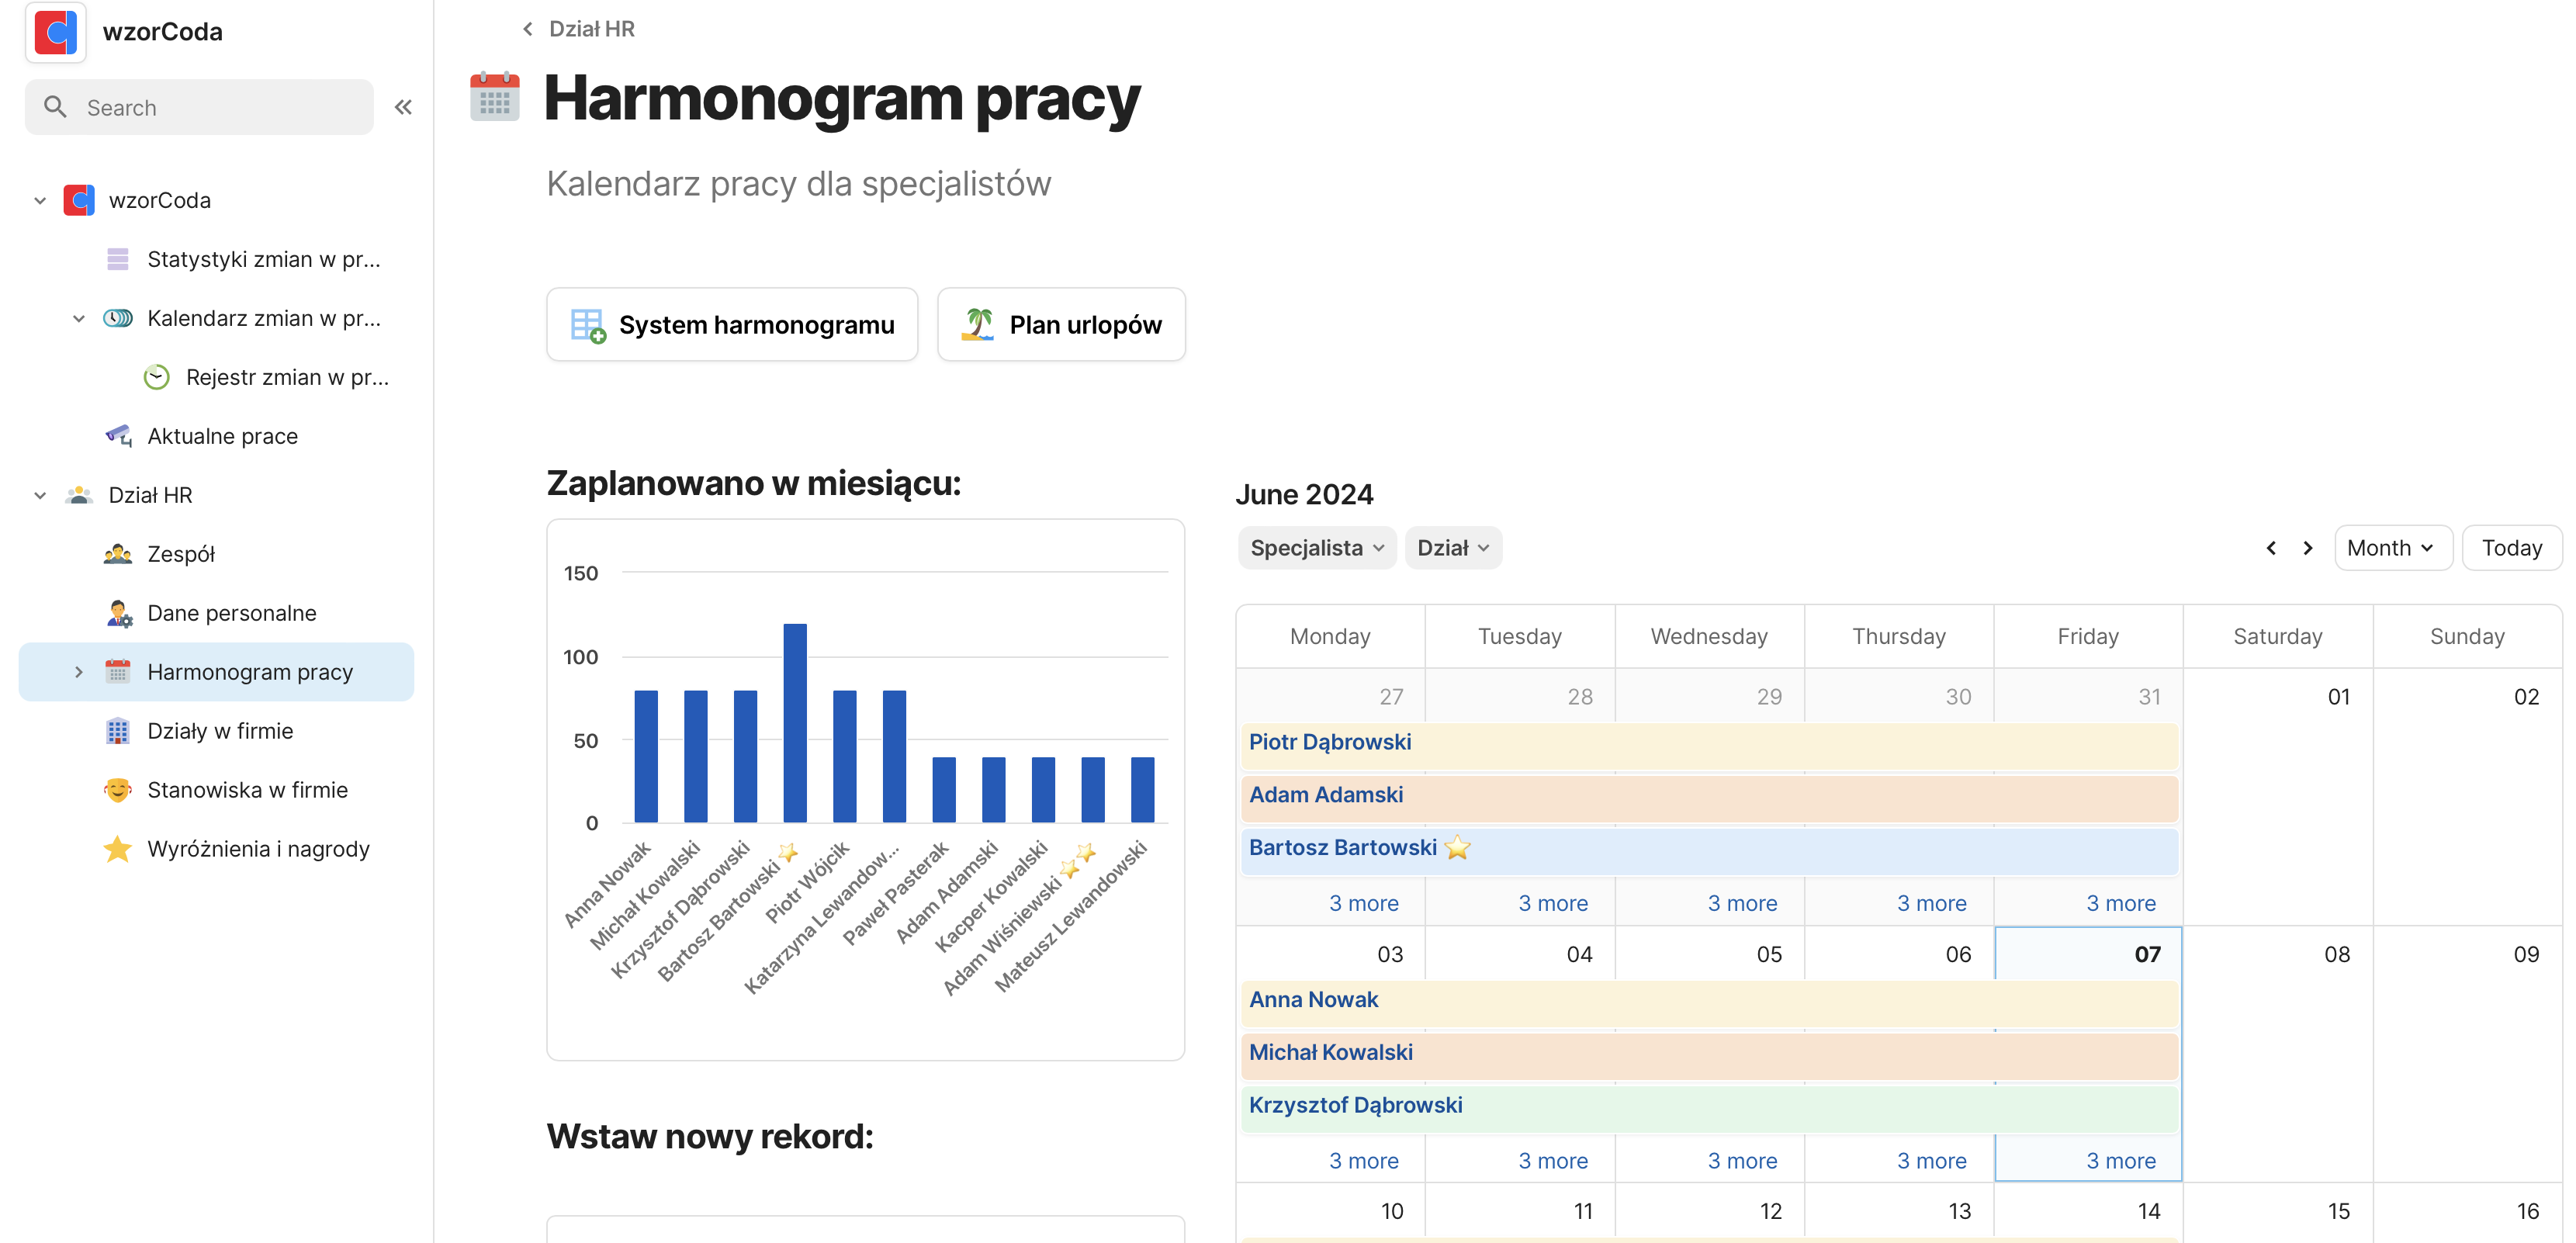
We have created a main team table and a table with defined departments in the organization.In this post, we will make a work calendar for specialists in the form of an easy-to-read calendar and a list for manager’s occupancy management. Coda.io allows you to display data from a table in the form of a calendar, which we will use in this entry.
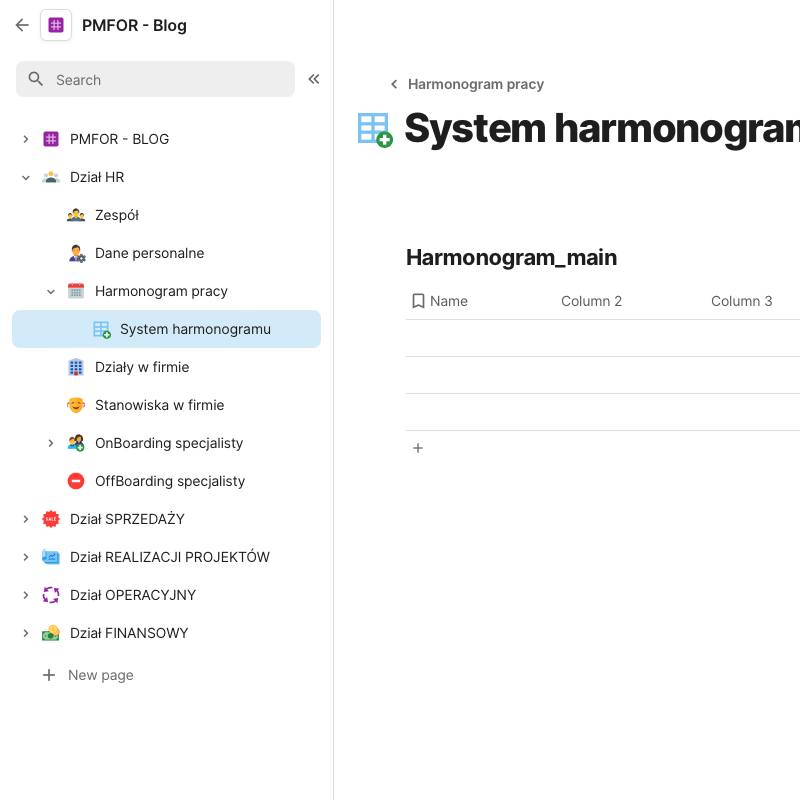
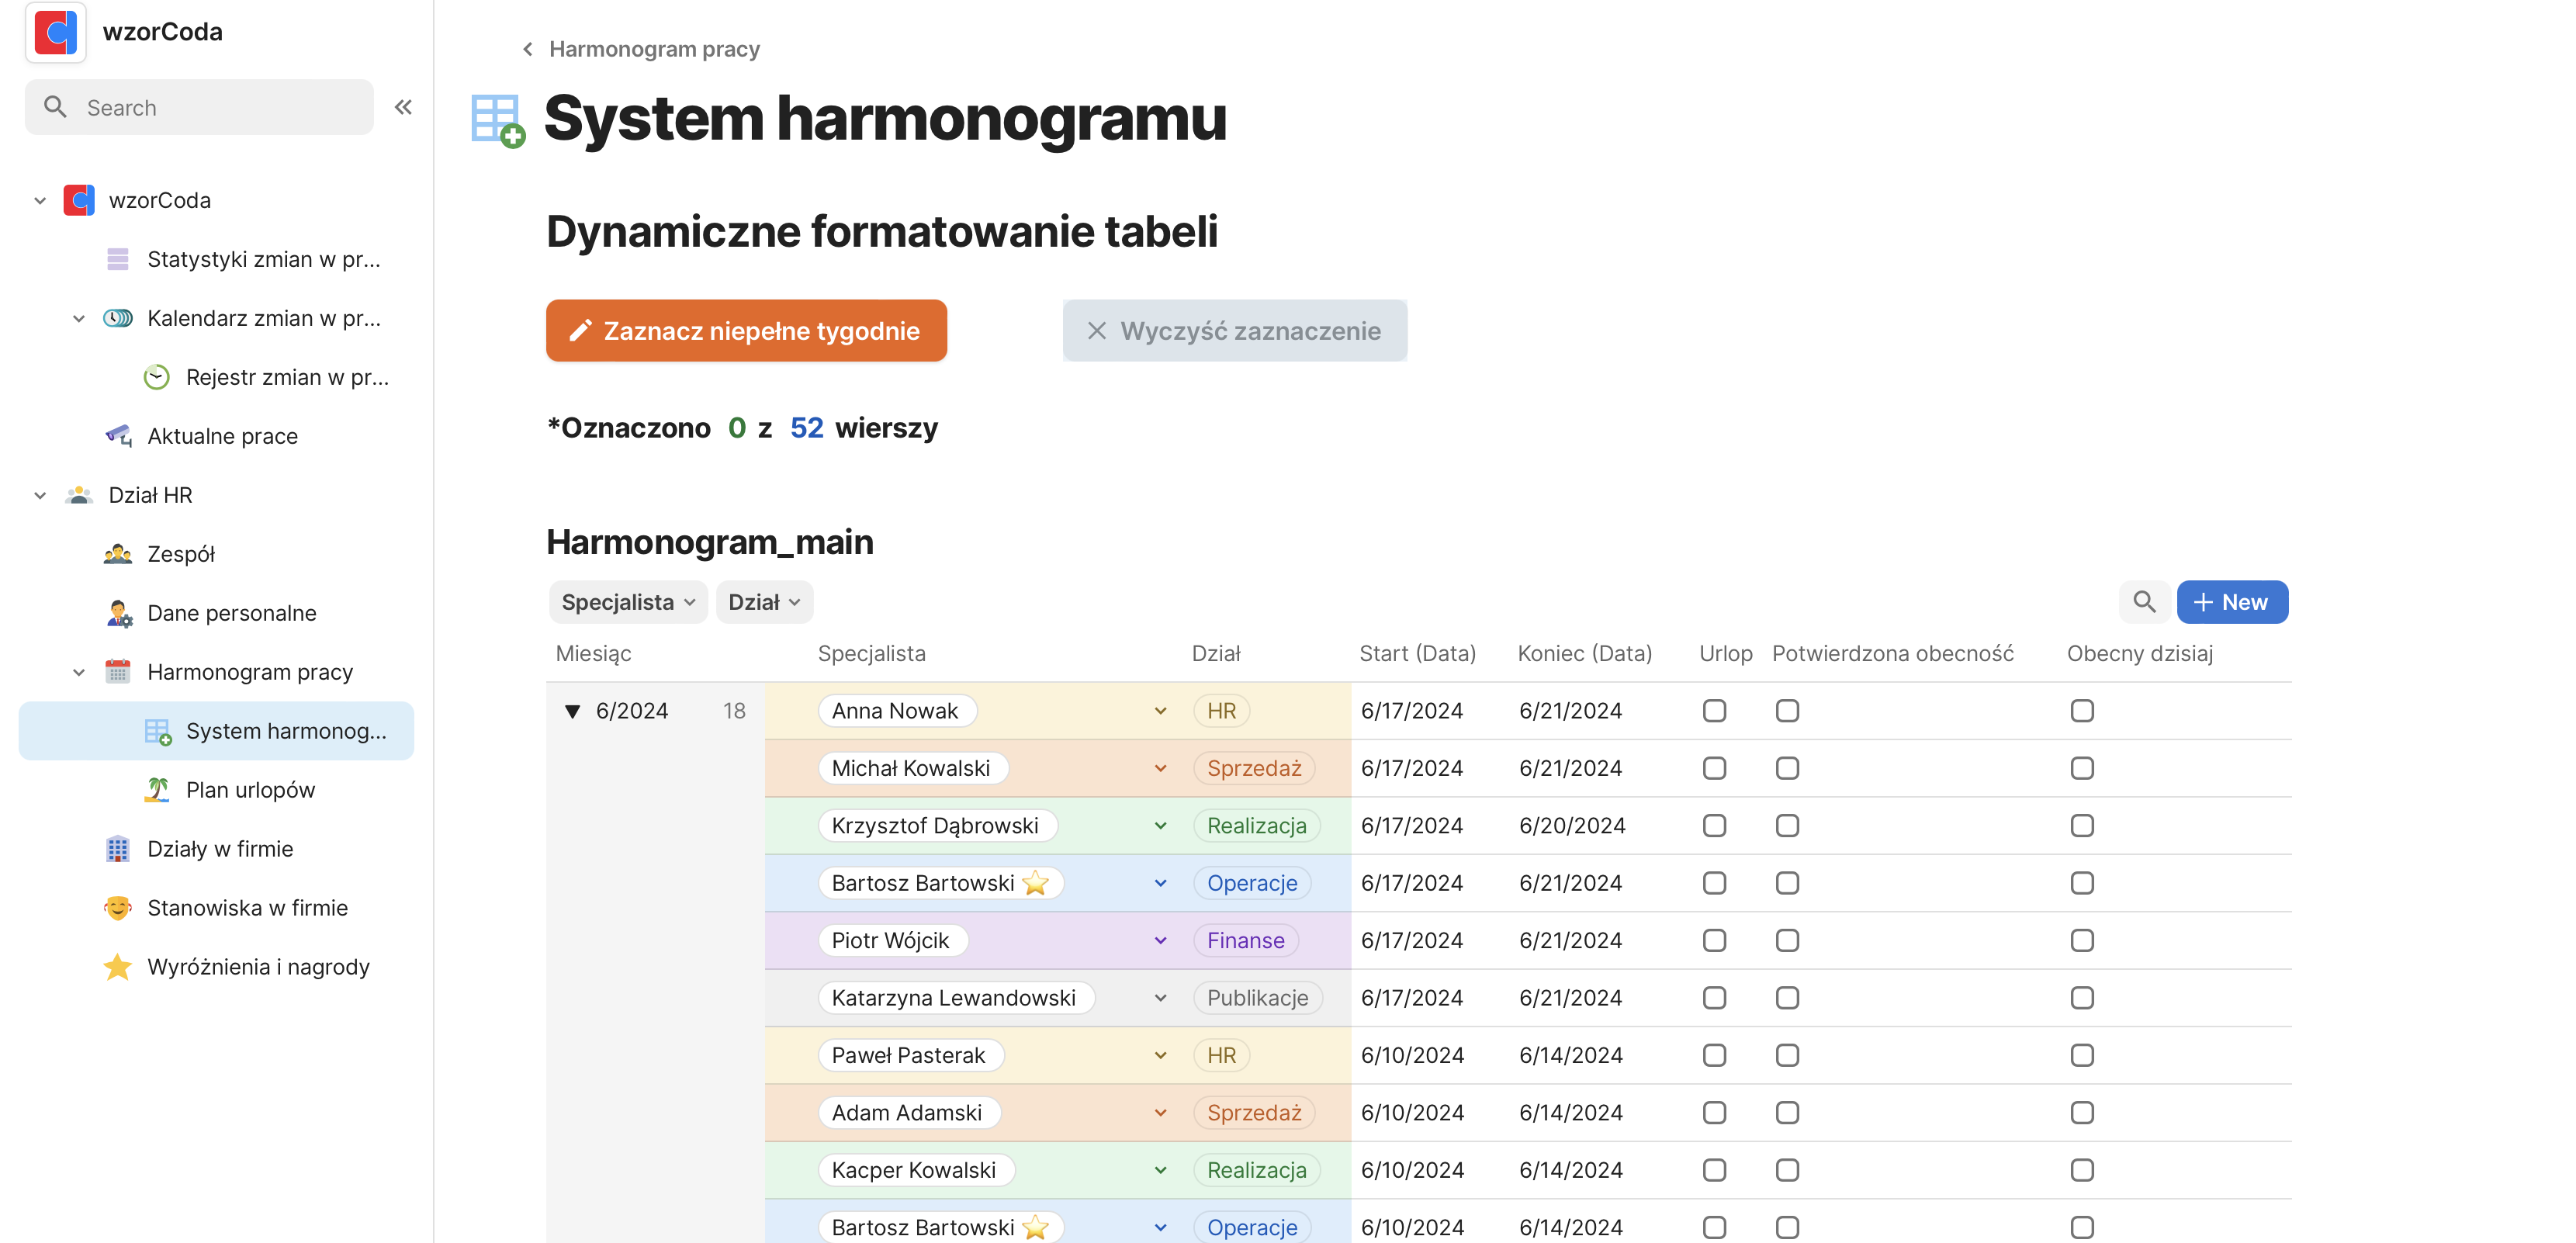
- We will start by adding two new documents to the existing structure:We will put a calendar in the WORK SCHEDULE, and the SCHEDULE SYSTEM will contain a table for managing information and occupancy:
- We will call the new table SCHEDULE_MAIN, following the convention that it will be the main table from which several other views will be created.In the table we will put such information as:- Specialist- Department- Date- Vacation- number of working days- number of vacation days
- We will now change the type of columns by defining what data will be stored in them:
– Specialist: Here a SELECT field with a selection of defined specialists in the organization (Selection field).
– Department: This field will update automatically based on the information to which department the specialist is assigned (Automatic field)
– Date: In order to have the ability to define a range of days from-to, it will be necessary to create two columns START (Date) and END (Date). (Checkbox)
– Vacation: This is a checkbox to uncheck if the indicated days in DATE are vacation days (Checkbox)
– Number of work days: Display for each the sum of days specified as working (Auto field)
– number of working hours: Display the number of hours worked on the specified days
– il. days of vacation: Similar to the above,. we will display the sum of the number of vacation days from the date range specified in the Date column (Automatic field)
The above three items require a condition to check whether the record is a vacation or work day record - For example, an automatic field assigning a department to a specialist:
- Final result we get:
- Now we create an alternative view of this table and display it as CALENDAR
- We will add formatting so that each department has its own color according to the adopted color scheme in previous entries
Formatting given to the main table is automatically transferred to the calendar view: - We will rename the view and hide it (it is not needed)
- We will add filtering by specialist and department in the form of a bar above the calendar
- We will add formatting so that each department has its own color according to the adopted color scheme in previous entries
Formatting given to the main table is automatically transferred to the calendar view: - We have the work schedule, so now we will deal with the vacation schedule. The creation will be very simple: We will create an alternative calendar view and change the filtering from all “non-holiday” items to “vacation” ones:
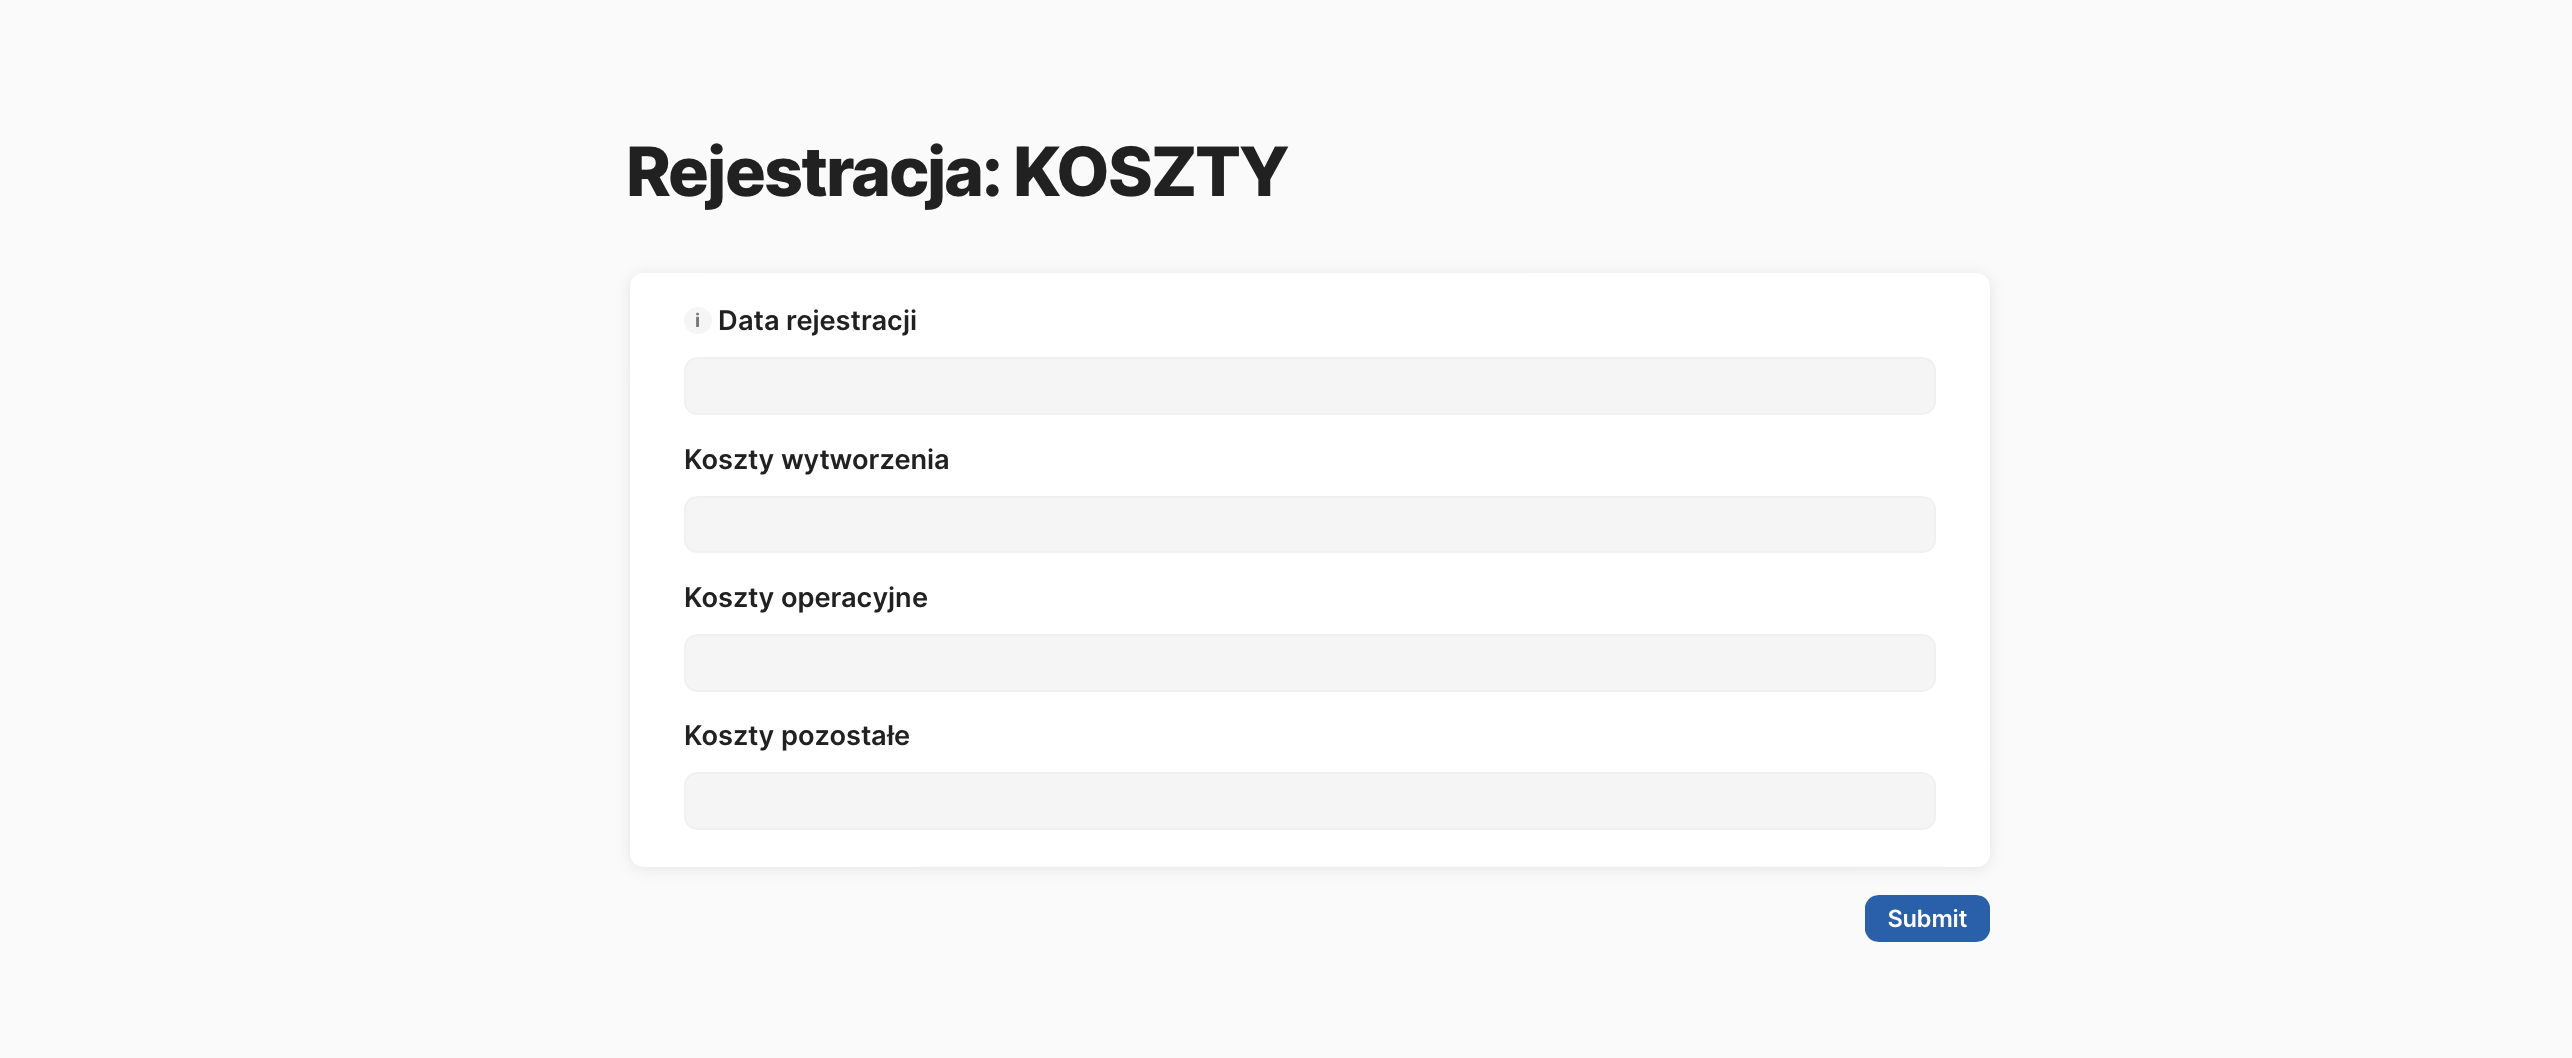
- Finally, we will still modify the system for displaying and entering new items into the schedule
I added a checkbox to the schedule table for confirming the attendance of a specialist as scheduled, filtering by specialist and department, and grouped the rows by month – to keep the table readable in the future - Adding new positions is done from the Schedule_main table, but it may be helpful to add a new position at the same time looking at the calendar. To provide such functionality, we will add another alternative view of the schedule table, this time as a FORM and place it next to the calendar
-
Below that, all that is missing is the current month’s statistics to help plan for even occupancy
Thus, we have obtained a functional dashboard for Team Leaders to plan the work schedule of subordinate specialists,